your food tracker, now with carbon efficiency
>200 million people track their macros. fewer than a million track the carbon cost of eating. no tool does both.


diet and carbon tracking tools don't talk to each other
I am changing my diet and going to track my nutrition.
I wonder how that will affect the environment.
Have you tried a carbon calculator?
Yeah but if I'm already tracking my meals…
If only MyFitnessPal had built-in emissions info like Google Flights 🤔
october 2025. we started building the next monday.
emissions data nudges demand
google flights put a CO₂e figure next to every fare. studies since have measured a 4–12% shift toward lower-emissions options1 2. nobody has run that experiment on food.
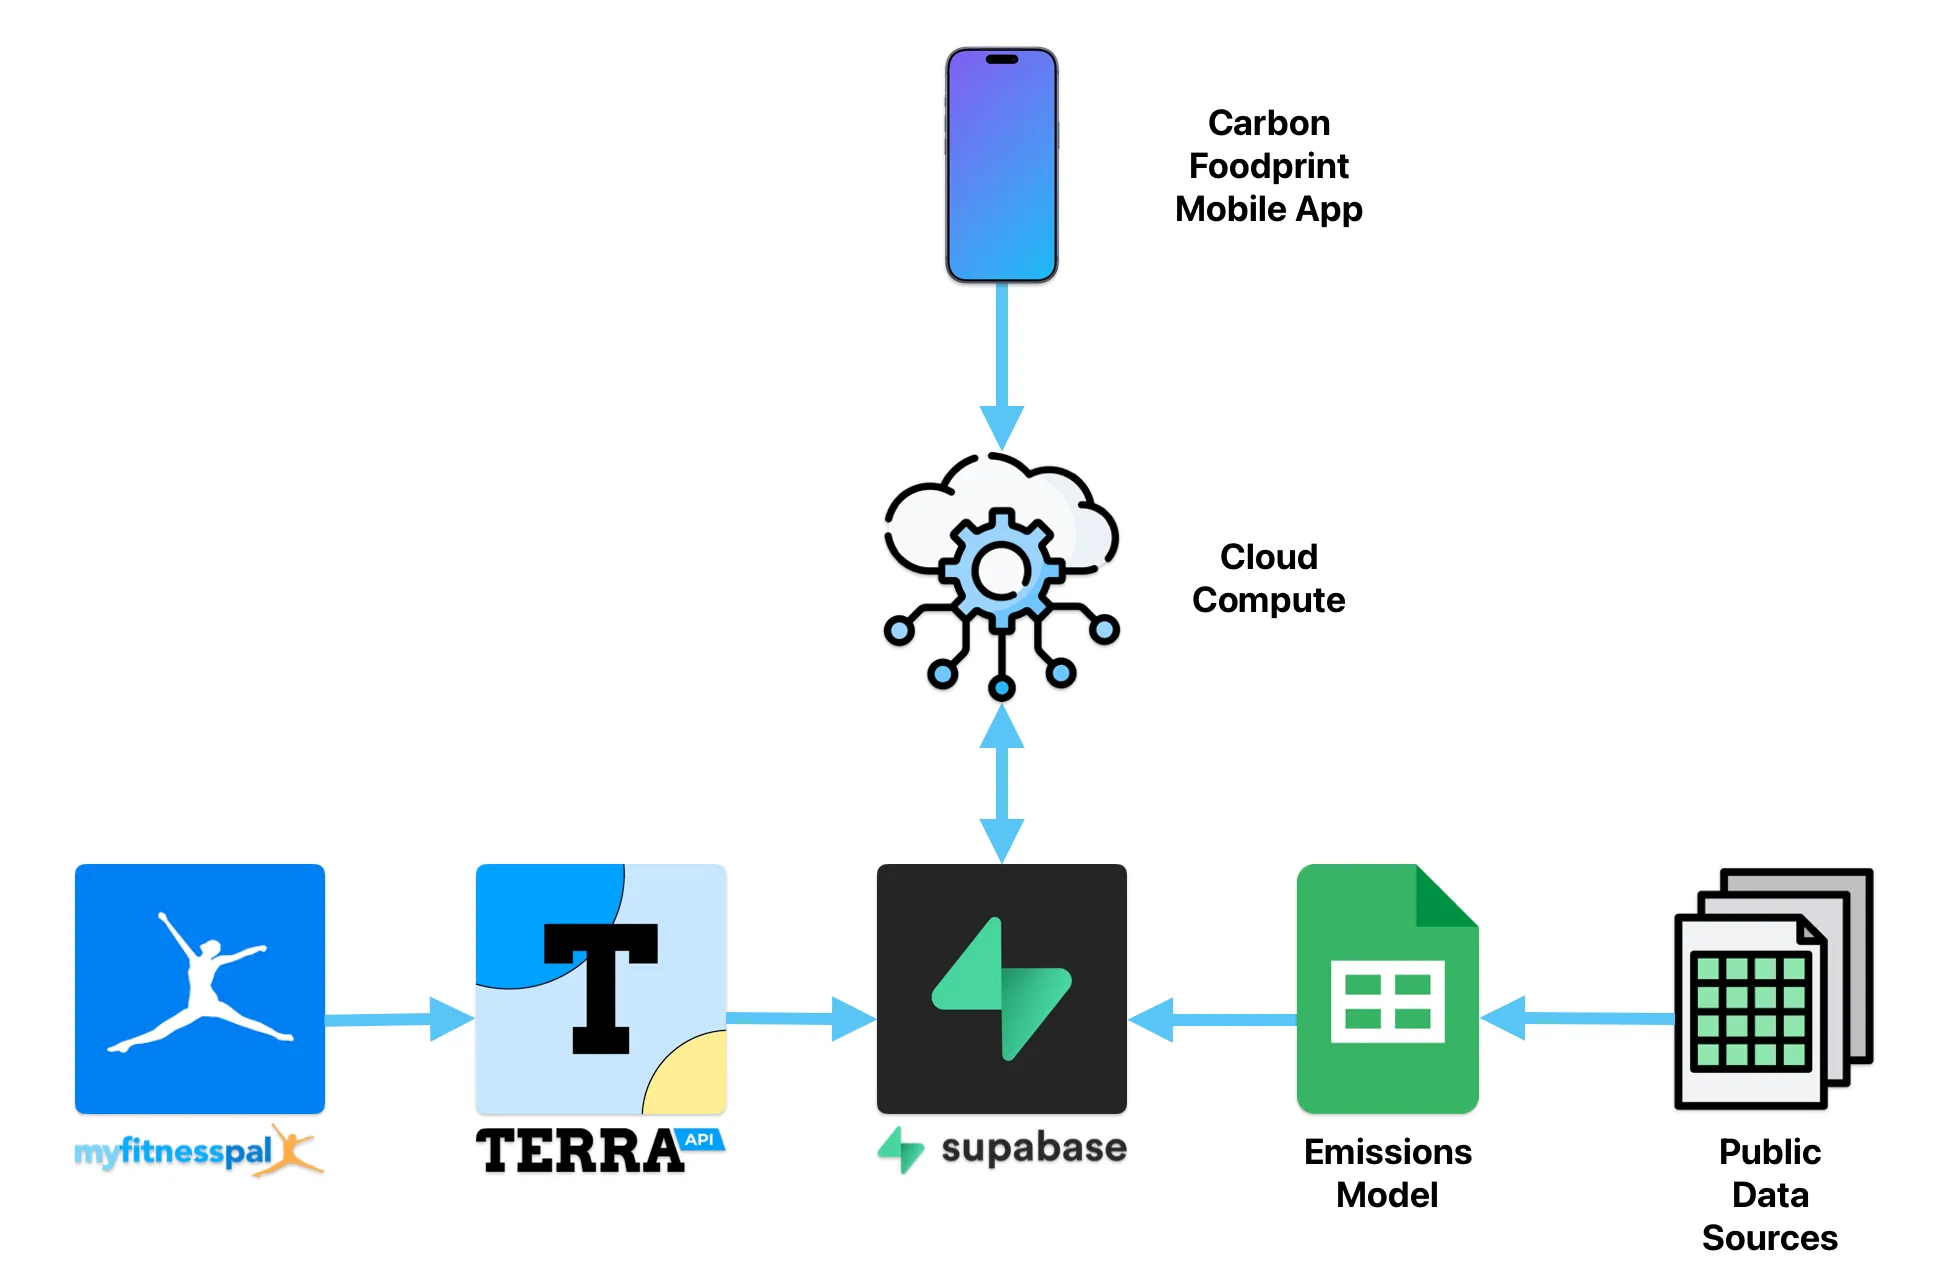
we brought meal tracking and carbon accounting together
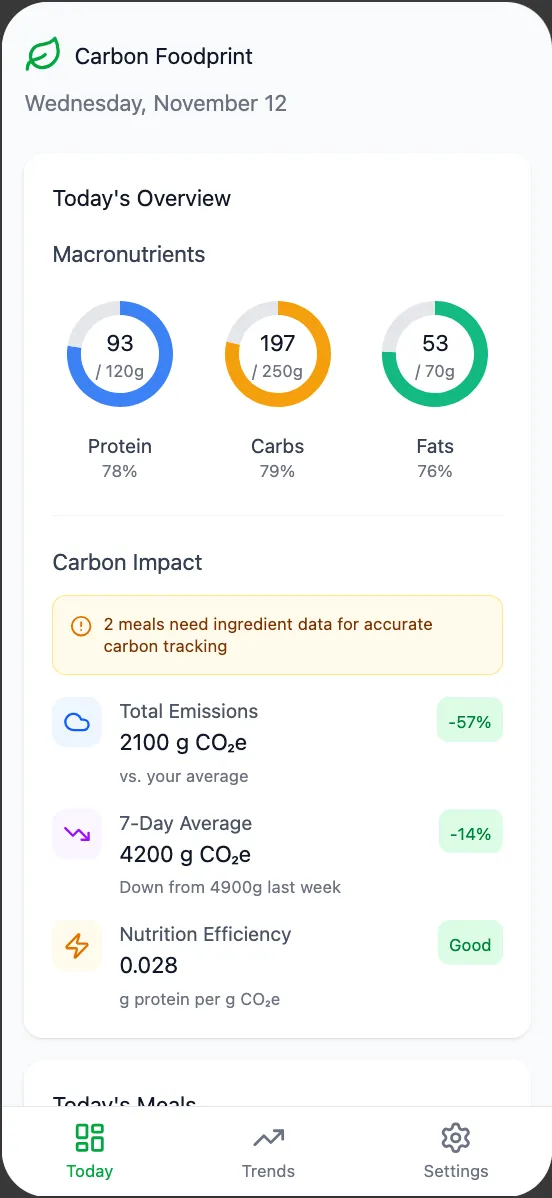
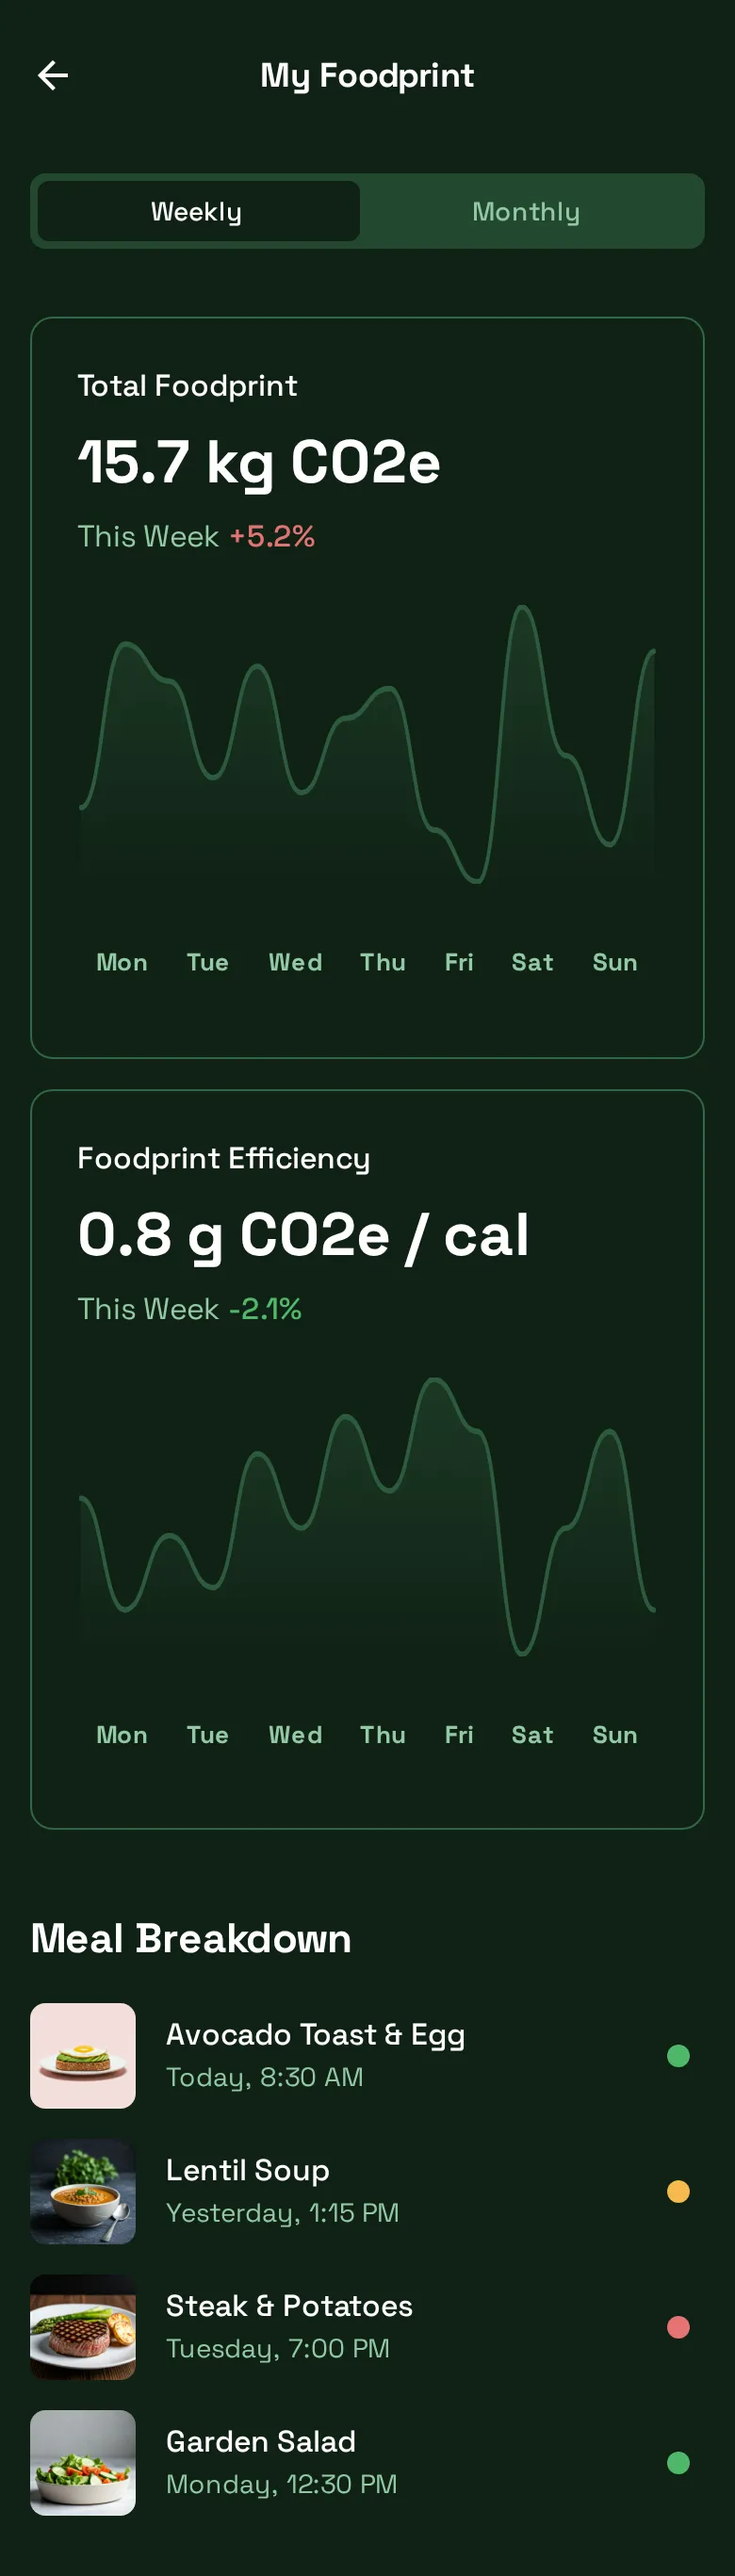
- foodprint
- g CO₂eq
- efficiency
- g protein / foodprint
- trend
- ± % avg efficiency
- cost-effectiveness
- efficiency / cost
we deliberately don't set carbon targets. we won't ask anyone to trade nutrition for climate.
the model is the hard part
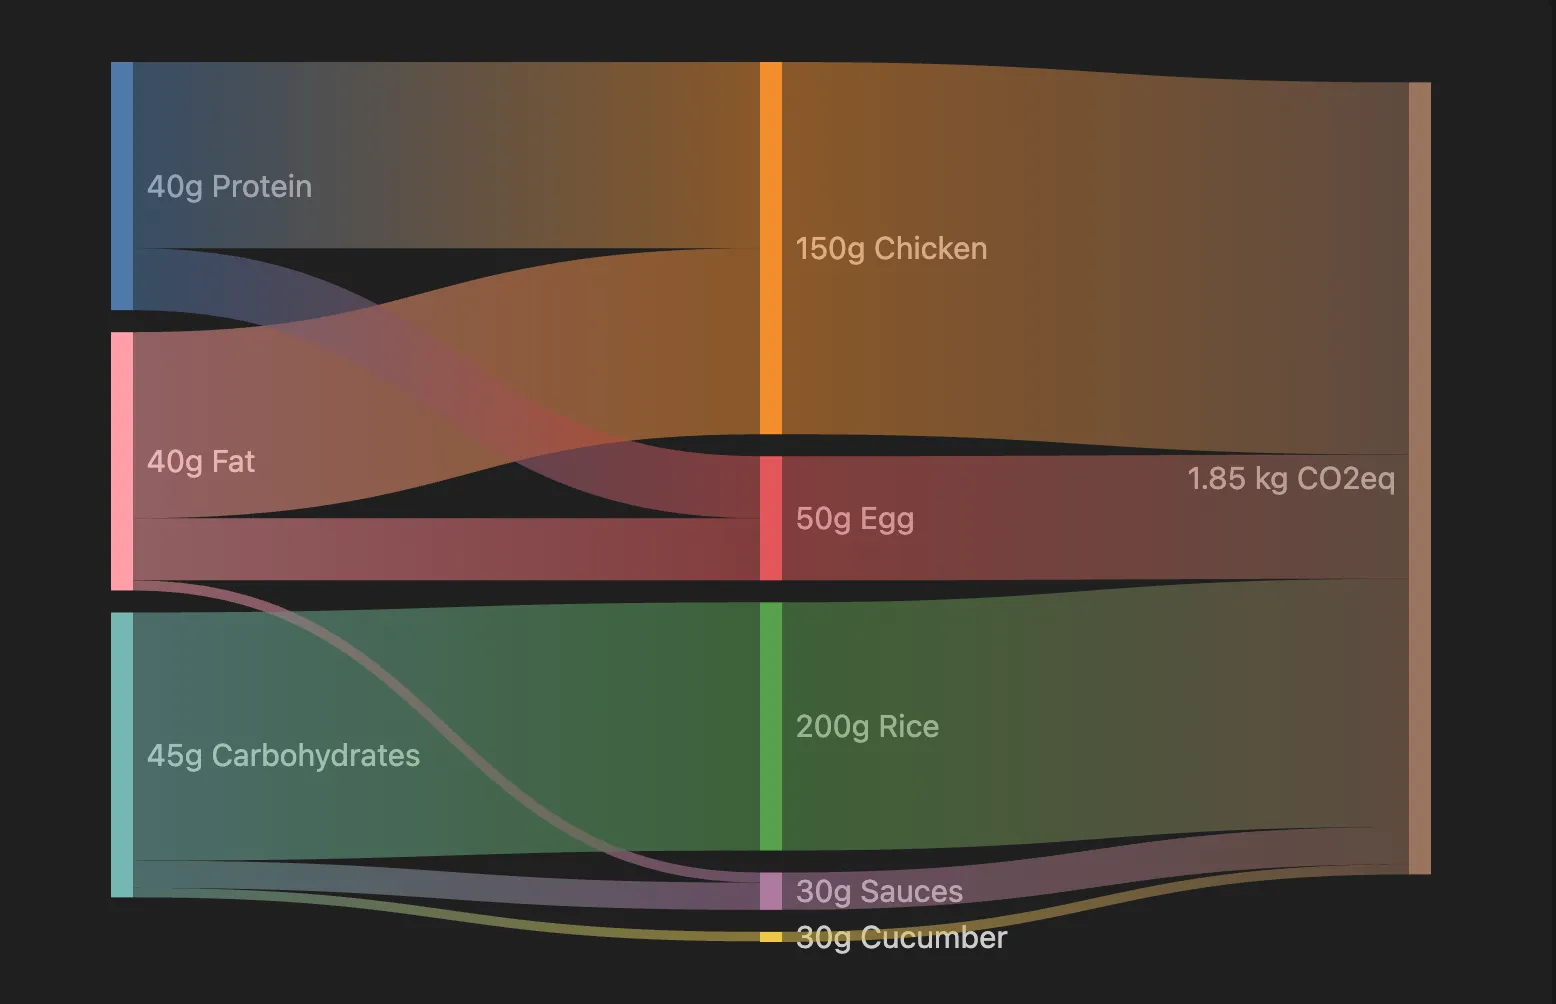
our v0.2 model maps ingredients to g CO₂eq using Poore & Nemecek (2018) — 38,700 farms, 119 countries, farm-to-retail — extended with Ecoinvent and a hand-built set of common ingredients the public datasets miss.
known limitations
- — public data is thin, aggregated, and years old
- — coverage stops at the major food categories
- — huge real variability is hidden inside single averages
- — processing and logistics stages are missing or inconsistent (drying, roasting, fresh vs frozen)
- — system boundaries and methodologies don't agree across sources
- — meal data arrives as macros, not ingredients, so we infer
we publish the mapping and the uncertainty rather than hide them. if you work with primary LCA inventories, product-level footprints, or supplier data — including data that can't be published — we'd like to compare notes.
where you fit in
validate the problem
is there real demand for a meal-level foodprint?
improve the model
better coverage, honest uncertainty, regional factors
meet people where they eat
delivery apps, cafeterias, nutrition platforms
we're looking for
shipping log
- 2025-12-04
- capstone presentation
- 2025-11-25
- emissions model v0.1, sankey prototype
- 2025-11-12
- app screens designed
- 2025-10-16
- first pitch, climatebase cohort 5